This article is about how at work we solved the issue of high response time while executing Redis commands from Node.js server to a Redis compatible database known as dragonfly.
Background
After introducing metrics to our Node.js service, we started recording the overall response time whenever a Redis command was executed. We had a wrapper service around a Redis driver known as ioredis for interacting with our Redis-compatible database.
Once we set up Grafana dashboards for metrics like cache latency, we saw unusually high p99 latency numbers, close to 200ms. This is a very large number, especially considering the underlying database query itself typically takes less than 10ms to complete. To understand why this latency was so high, we needed more detailed insight than metrics alone could provide. As part of a broader effort to set up our observability stack, I had been exploring various tracing solutions – options ranged from open-source SDKs (OpenTelemetry Node.js SDK) with a self-deployed trace backend, to third-party managed solutions (Datadog, Middleware, etc.). For this investigation, we decided to proceed with a self-hosted Grafana Tempo instance to test the setup and feasibility. (So far, the setup is working great, and I’m planning a detailed blog post on our observability architecture soon). With tracing set up, we could get a waterfall view of the path taken by the service while responding to things like HTTP requests or event processing, which we hoped would pinpoint the source of the delay in our Redis command execution.
 An example trace showing Redis commands executed while processing an HTTP request.
Okay, back to the problem. After setting up tracing, we could visually inspect the Redis command spans, like in the example above. Correlating these trace timings with our earlier metrics confirmed the high latency numbers. Indeed, something wasn’t right with how our service was connecting to the cache server and executing commands.
Finding the culprit
Dragonfly is a Redis-compatible key-value database but with support for multithreading; Redis, on the other hand, follows a single-threaded, event-based model similar to Node.js.
Our first step was to check if anything was wrong with the cache server deployment itself. We enabled Dragonfly’s slow query logs to check for commands taking longer than 100ms. Interestingly, we only saw SCAN commands in these logs. This didn’t immediately make sense because our high latency metrics were observed for commands like GET, SET, DELETE, and UNLINK. These are typically O(1) commands and should not take more than a few milliseconds, so we ruled out the possibility of these specific commands taking significant time to process on the cache server itself.
To further monitor command execution time directly on the Dragonfly server, we enabled its Prometheus metrics exporter. We looked at two metrics: “Pipeline Latency” and “Average Pipeline Length”. The “Average Pipeline Length” was always close to 0, and the “Pipeline Latency” was consistently under 10ms. While there wasn’t clear documentation from Dragonfly detailing these metrics precisely, going by the names, we assumed they represented the actual command execution time on the cache server.
So, the evidence suggested commands were executing quickly on the cache server (confirmed by both low Prometheus pipeline latency and the absence of GET/SET etc., in the slow query logs). But wait – the slow query logs did show the SCAN command with execution times in the range of 50ms to 200ms. So, what exactly is the SCAN command, and why were we using it?
The SCAN Command and Frequent Use
First, what is the SCAN command? SCAN is a cursor-based command in Redis used to iterate over the keyspace. It takes a cursor position and a glob pattern, matching the pattern against keys in the database without blocking the server for long periods (unlike its predecessor, KEYS).
In our system, we primarily use SCAN to invalidate cache entries for specific users. We publish cache invalidation events from various parts of our application. Depending on the event type, a process triggers that uses SCAN to find and delete cache keys matching a user-specific pattern. Since these invalidation events are very frequent in our workload, the SCAN command was executed much more often than we initially realized.
The Restart Clue and Initial Hypotheses
During our investigation, we stumbled upon a curious behavior: if we restarted the DragonflyDB instance, the high command latency would drop back to normal levels for a few hours before inevitably climbing back up to the problematic 200ms range. This provided a temporary, albeit disruptive, fix during peak hours (the cost being the loss of cached data, although we later mitigated this by enabling snapshotting for restores).
This temporary “fix” from restarting was a significant clue. It strongly suggested the problem wasn’t necessarily the SCAN command’s execution on the server (which slow logs and metrics already indicated was fast most of the time, except for SCAN itself sometimes), but perhaps something related to the state of the connection or interaction between our Node.js services and DragonflyDB over time.
This led us to two main hypotheses related to connection handling:
- Connection Pooling:
ioredis, the driver we were using, maintains a single connection to the Redis server. This is standard for single-threaded Redis, where multiple connections offer little benefit. However, DragonflyDB is multi-threaded. Could our single connection be a bottleneck when dealing with frequent commands, especially potentially long-runningSCANoperations, under Dragonfly’s multi-threaded architecture? Perhaps connection pooling would allow better parallel execution. - Long-Running TCP Connections: Could the TCP connections themselves, after being open for extended periods, degrade in performance or enter a state that caused delays in sending commands or receiving responses?
Investigating Connection Pooling
To test the connection pooling hypothesis, we considered adding a pooling library like generic-pool on top of ioredis. However, we noticed that node-redis, the official Redis client for Node.js, already included built-in connection pooling capabilities and had an API largely compatible with ioredis. So, as a direct way to test the effect of pooling, we replaced ioredis with node-redis in our service.
Unfortunately, even with node-redis and its connection pooling configured, the behavior remained the same: high latencies persisted, only dropping temporarily after a DragonflyDB restart. This seemed to rule out simple connection pooling as the solution.
Investigating TCP Connection State
With the pooling hypothesis proving unfruitful, we turned to the idea of issues with long-running TCP connections. We tried several approaches to detect problems here:
- Code Profiling: We profiled the Node.js service during periods of high latency, generating flame graphs to see if significant time was being spent within the Redis driver’s internal methods, specifically looking for delays in writing to or reading from the underlying network socket.
- Packet Tracing: We used
tcpdumpon the service instances to capture network traffic between the Node.js service and DragonflyDB, looking for signs of network-level latency, packet loss, or retransmissions that could explain the delays.
Both of these efforts came up empty. The profiling data showed no unusual delays within the driver’s socket operations, and the tcpdump analysis indicated normal network communication without significant latency.
We had confirmed the high frequency of SCAN, observed the strange restart behavior, and ruled out both simple connection pooling and obvious TCP-level network issues as the root cause. We needed a new hypothesis.
A Perfect Correlation and the Root Cause
We refocused on the most reliable clue: why did restarting the cache server temporarily fix the latency? We had ruled out connection management issues. The other major effect of a restart was clearing the in-memory key-value store (remember, at this stage, we weren’t restoring snapshots immediately after restarts). Plotting the number of keys in DragonflyDB over time confirmed our suspicion. We saw the key count drop to zero after each restart and then steadily climb until the next restart.
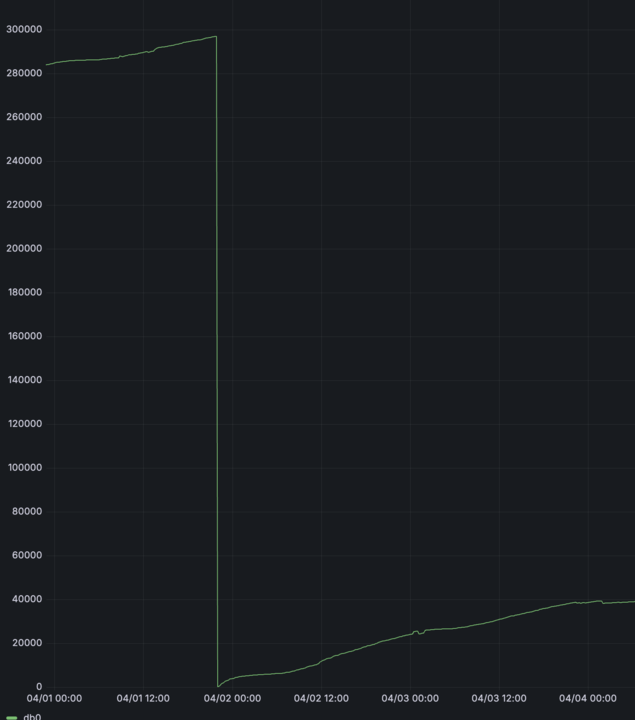 Correlating this key count graph with our latency metrics revealed a clear pattern: as the number of keys rose, so did the p99 latency for our Redis commands. Although Redis/DragonflyDB can handle millions of keys, we started seeing significant latency increases once the key count grew into the 100,000–200,000 range in our specific setup. Now, which of our commands would be most affected by the number of keys? Looking at our common operations (
GET, SET, DEL, UNLINK, SCAN, EXISTS), SCAN stood out. While most Redis commands have O(1) complexity, SCAN’s performance is inherently tied to the number of keys it needs to iterate over. (More details on SCAN’s behavior can be found in the official Redis documentation). We were using SCAN extensively for cache invalidation, employing code similar to this:
1const keysToDelete = [];
2
3for await (const key of this.client.scanIterator({
4	MATCH: pattern,
5	COUNT: count,
6})) {
7	keysToDelete.push(key);
8}
Critically, for each cache invalidation event (which were frequent), we potentially ran multiple SCAN operations, and each scanIterator loop continued until the entire relevant portion of the keyspace was traversed to find all keys matching the pattern.
But how could SCAN, even if sometimes slow itself (as seen in the slow logs), cause delays for fast O(1) commands like GET or SET? Our server-side metrics (like Dragonfly’s Pipeline Latency) showed quick execution times for those O(1) commands. This led to a new hypothesis: the server metrics likely measured only the actual CPU time for command execution, not the total turnaround time experienced by the client, which includes any wait time before the command gets processed.
Even though SCAN is non-blocking, issuing a large number of SCAN commands concurrently, especially when each needs to iterate over a growing keyspace (100k-200k+ keys), could potentially overwhelm the server’s connection-handling threads (even Dragonfly’s multiple threads). If threads were busy processing numerous, longer-running SCAN iterations, incoming GET, SET, etc., commands would have to wait longer before being picked up for execution, increasing their total observed latency from the client’s perspective. The performance degradation of SCAN with more keys, combined with its high frequency, created a bottleneck that impacted all other operations.
The Fix: Replacing SCAN with SETs
Armed with this hypothesis, the fix became clear: we needed to drastically reduce or eliminate our reliance on SCAN for finding keys to invalidate.
We implemented an alternative approach:
- For each user (or entity needing cache invalidation), maintain a Redis SET containing the keys associated with that user.
- When an invalidation event occurs for a user, instead of scanning the keyspace, retrieve the list of keys directly from the user’s specific SET using the
SMEMBERScommand (which is much faster for this purpose). - Delete the keys obtained from the SET.
This required some additional logic (housekeeping) to keep these SETs up-to-date as new keys were cached, but the performance benefits far outweighed the complexity.
So we opted for a more optimal way to invalidate cache where we also stored key names related to a user in a redis SET, so the use of SCAN was not moot because we do not need to scan the namespace every time to first prepare list of keys to delete now we can get that with just a SMEMBERS command which gives list of set elements. A little housekeeping was needed to maintain this set for each user, but it still outweighs the benefits.
The Results: Latency Tamed
This change dramatically solved the high latency issue.
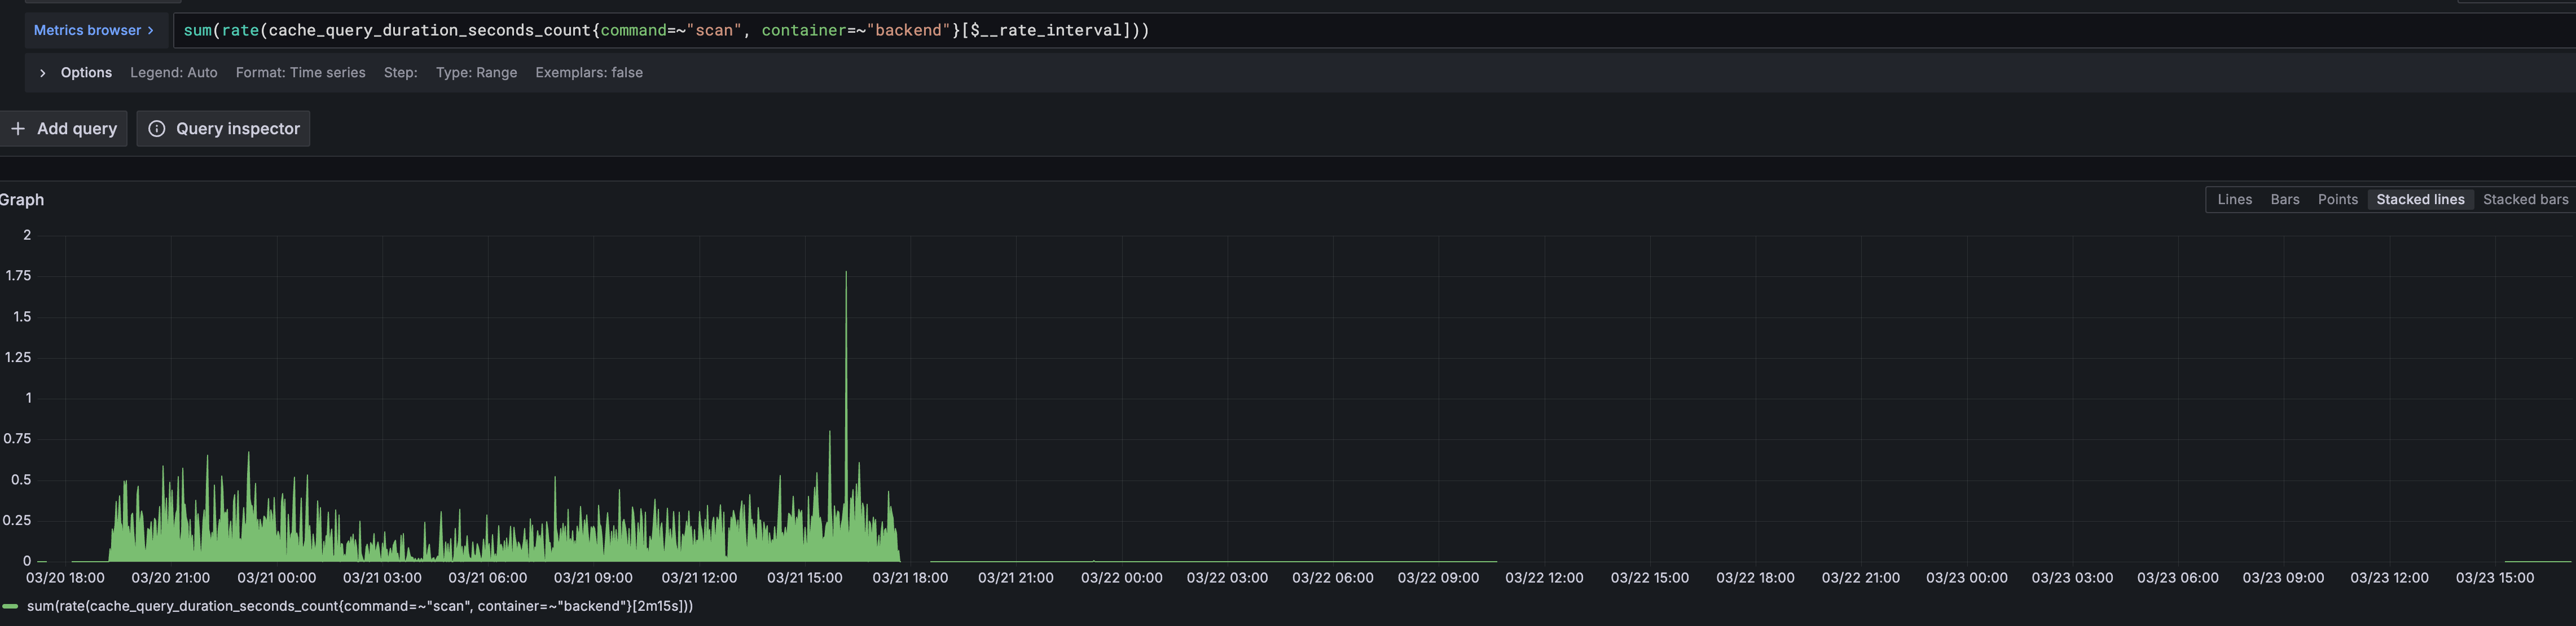
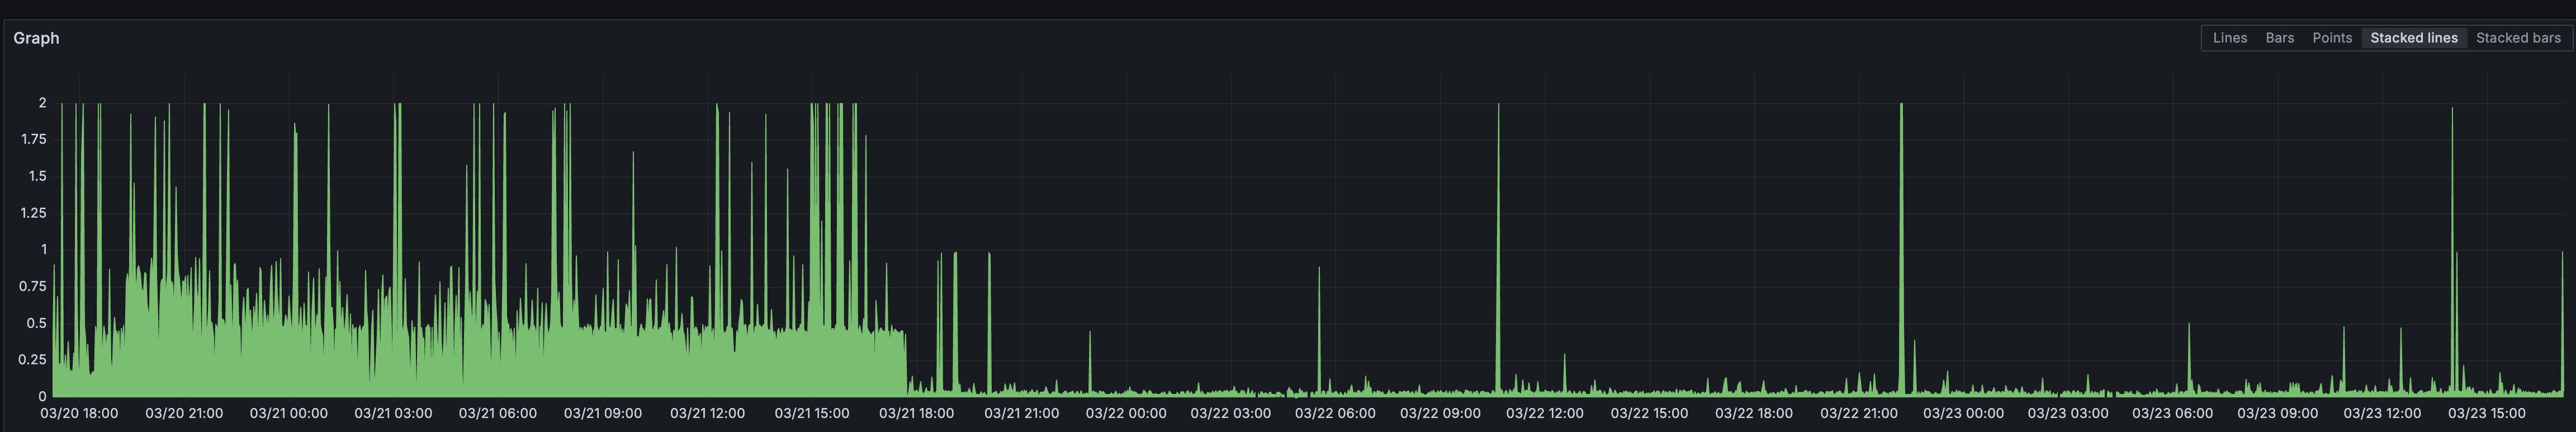
First, the frequency of the SCAN command dropped to nearly zero, as expected.
Consequently, the latency spikes across all commands disappeared. The overall p99 latency stabilized at a much healthier level.
Interestingly, even the server-side execution time reported by Dragonfly showed improvement, suggesting the reduced load from SCAN allowed other commands to be processed more efficiently internally as well.
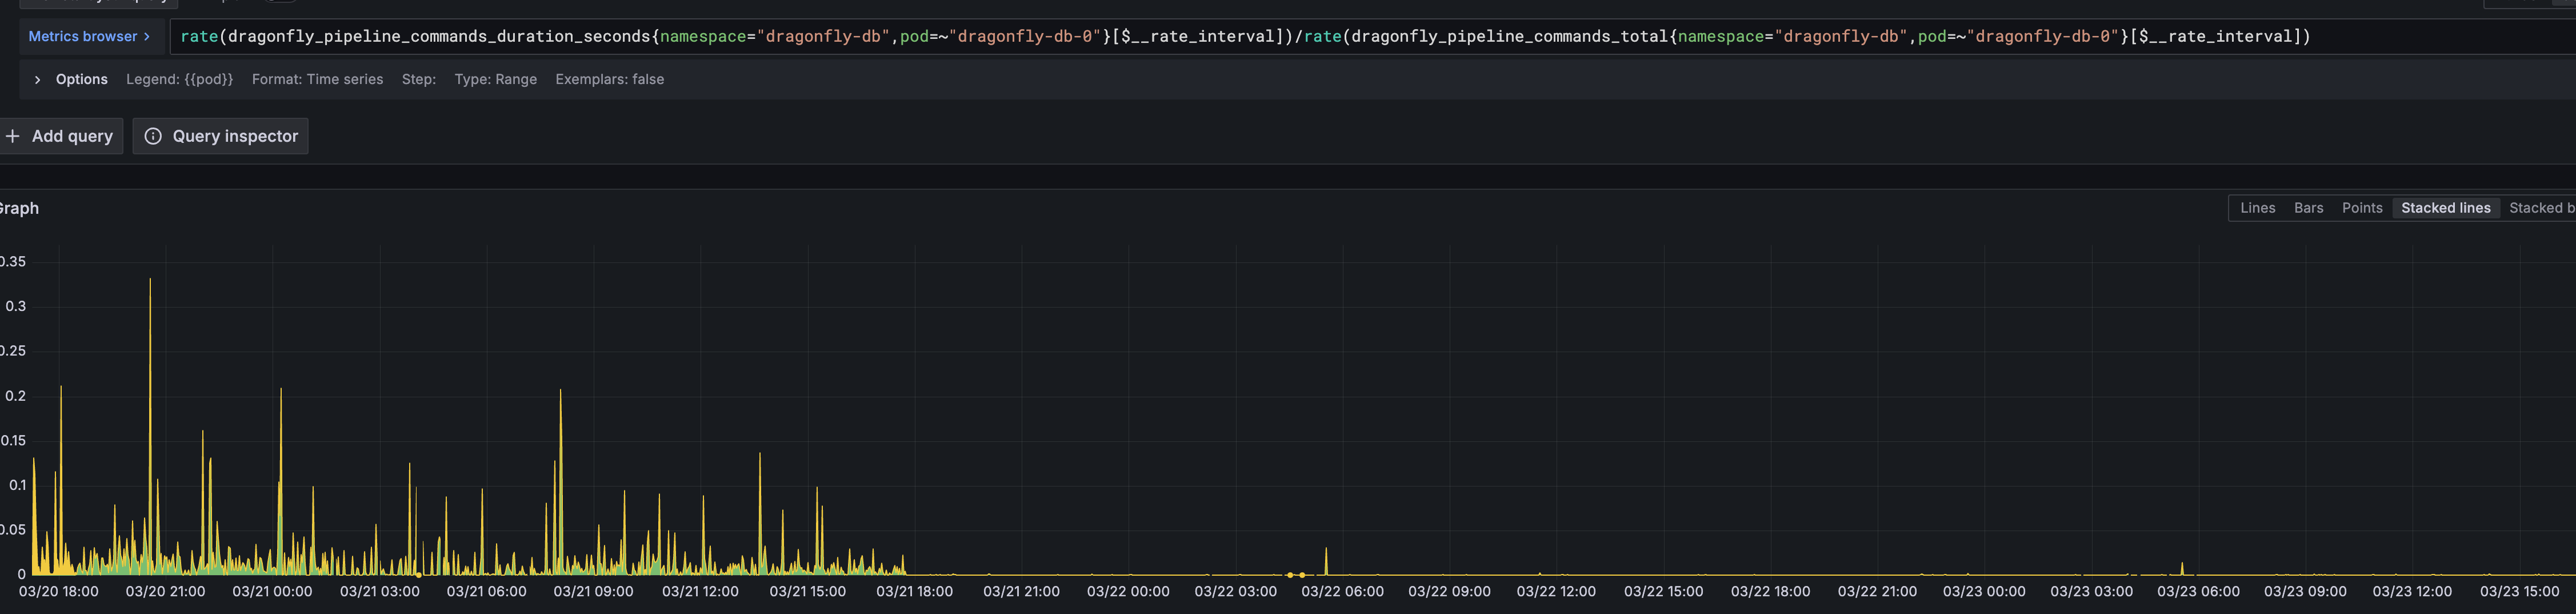
The final result was a significant drop in p99 latency, bringing it down from peaks often exceeding 200ms (and sometimes reaching ~500ms as shown below) to consistently around ~40ms.
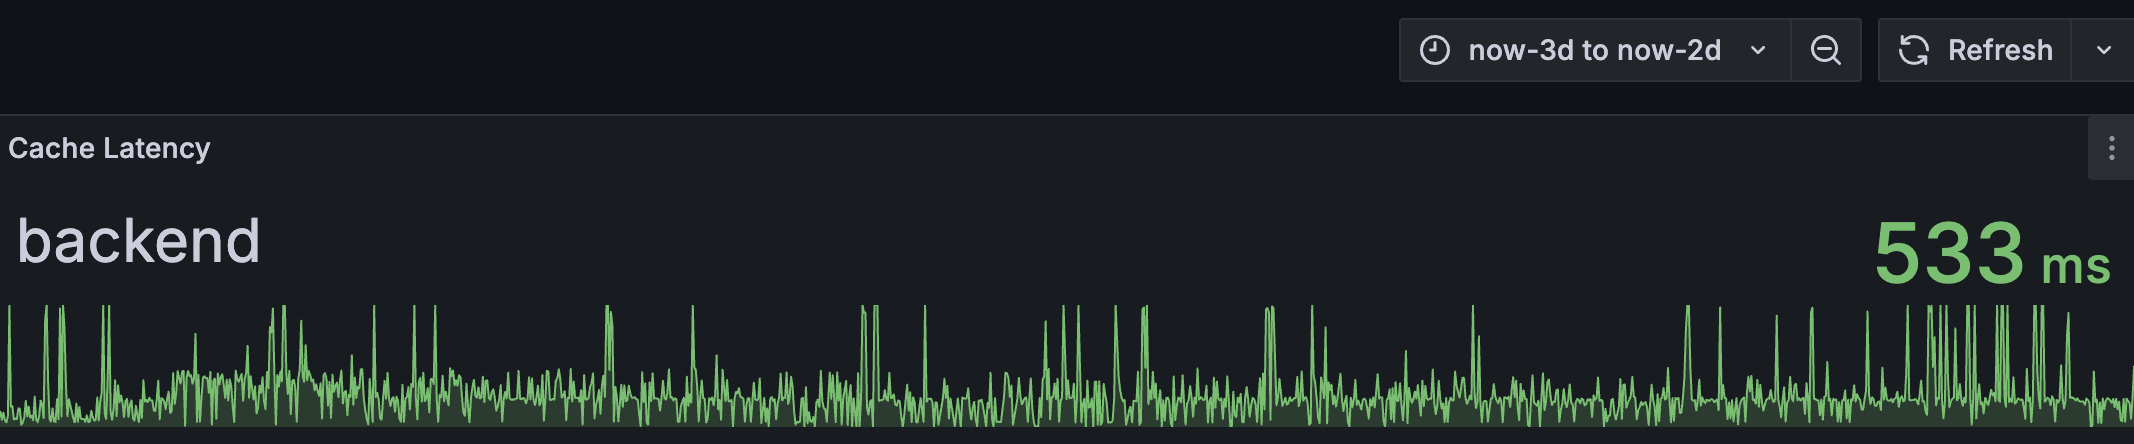
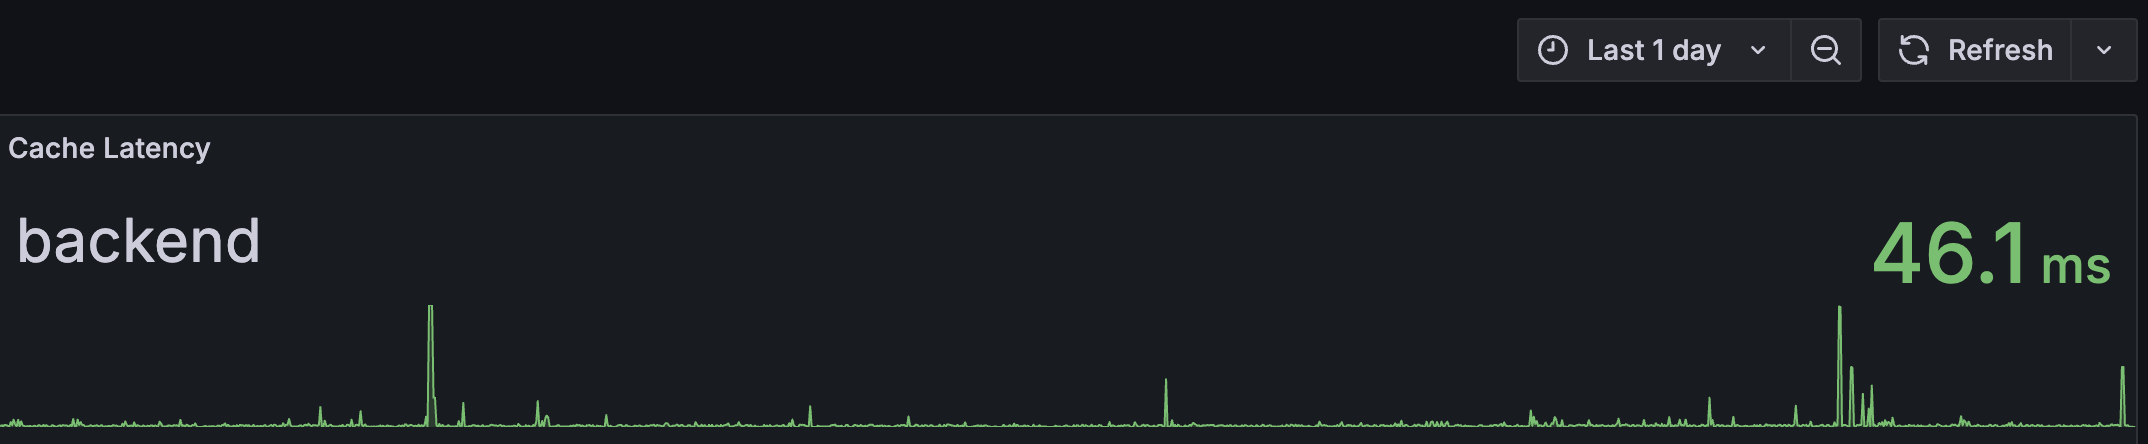 p99 latency comparison showing reduction from peaks around ~500ms down to ~40ms after the fix
Conclusion: Trust the Clues
Looking back at how we tackled our high Redis command latency (~200ms+ p99), the journey involved ramping up the setup for observability, and exploring several potential culprits. While investigating connection pooling, profiling code execution, and even analyzing network packets with tcpdump were valuable exercises, they ultimately didn’t lead us to the root cause in this case.
The most significant clue, in hindsight, was the temporary fix we got from restarting the DragonflyDB instance. If we had focused more intently from the start on why that restart helped – realizing it pointed directly to the state accumulated within the database (specifically, the key count) – and correlated that with our application’s command usage patterns, we likely would have identified the high-frequency, full-keyspace SCAN operations as the bottleneck much sooner.
The real issue wasn’t low-level network glitches or basic connection handling, but an application-level pattern: frequent SCANs over a growing keyspace were overwhelming the server, increasing wait times for all commands. Switching our invalidation logic to use Redis SETs (SMEMBERS) eliminated this problematic pattern, finally bringing our p99 latency down to a stable ~40ms. Although optimizing the SCAN operation itself using [[https://redis.io/docs/latest/operate/oss_and_stack/reference/cluster-spec/#hash-tags]] was another interesting possibility (ensuring keys with the same tag land in the same hash slot to potentially limit scan scope), we didn’t opt for this solution since this required a rethink of our cache key nomenclature and would have involved substantial changes.
Ultimately, the most direct path to a solution often lies in understanding the application’s behavior and trusting the most obvious clues, rather than immediately reaching for the deepest diagnostic tools.